See how your money is making an impact
All investors want transparency around where their money is going, even more so when it comes to sensitive ESG investments such as green bonds. As with all passive ETFs, fund holdings are disclosed daily and are readily available – you can easily find them online on Lyxor’s product pages.
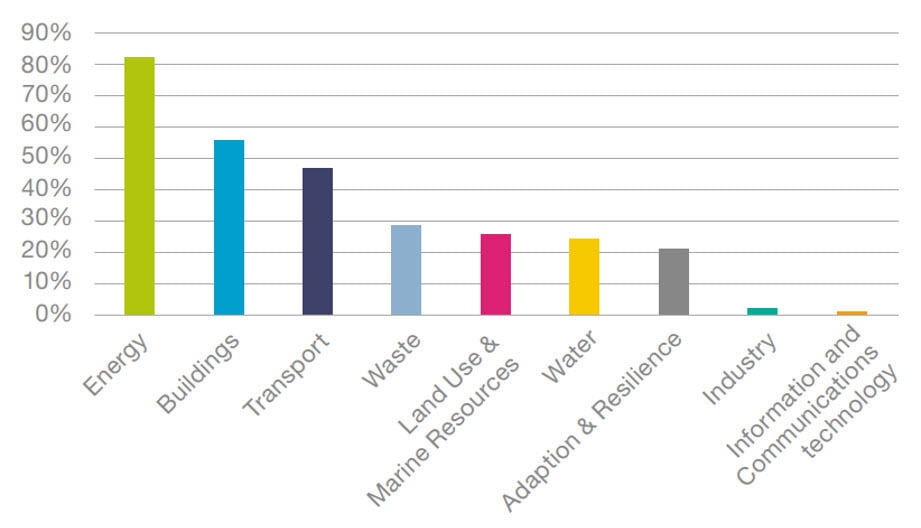
Furthermore, holders of our green bond ETFs can see the use-of-proceeds in action. The chart below shows the UoP (Use-of-Proceeds) category breakdown of the Solactive Green Bond EUR USD IG index underlying our ETF launched in 2017.3
Use-of-Proceeds breakdown - Solactive Green Bond EUR USD IG index3
But we don’t stop there. Knowing which kind of categories your money is financing is useful, but not enough to truly quantify the impact of your investment. That’s why we provide monthly reports on our website with detailed information on our funds’ climate and ESG metrics.
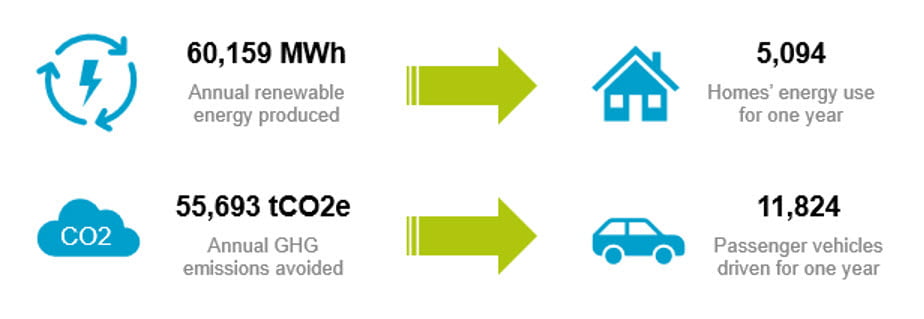
We also provide more tangible figures, such as new installed renewable energy generation capacity (in MWh) and emissions avoided (in tons of CO2). In more relatable terms, we estimate that the impact of our first green bond ETF over a one-year period equates to the average energy use of over 5,000 homes, or the equivalent in avoided emissions of close to 12,000 passenger vehicles driven for a year.4
Estimated impact of the Lyxor Green Bond (DR) UCITS ETF over a 1 year period4
3Lyxor International Asset Management, Climate Bonds Initiative. Data as at 26/08/2019. Some green bonds in the index have Use of Proceeds overlapping across multiple categories. 4Lyxor International Asset Management, as at 01/12/2019. These indicators account for 43% of the portfolio weight, where data was available. AUM of fund at time of calculation was €160m. Further explanations on methodology and assumptions available on request.